

Timeline Infographic
The Timeline Infographic is a unique and engaging long page experience that provides an entertaining way to display the timeline of your product, service, brand, or organization. With interactive elements along the way and countdown timer at the end, visitors will scroll through and participate as they learn more and create a deeper engagement with your brand.
COMPLEXITY

Low
TYPE

Infographic
USE CASE

Engagement
Features available
Here are the major features, abilities, and interactive elements used in this template.
Animation
Anchor Link
Custom Code
Tabs
How-to use


On the Canvas and within the Tabs content section, hover over the general area until you highlight the Tab Section and then select it. Within it there is currently a two column Responsive Grid, feel free to edit the grid itself, the contents within it's columns, or remove it and in other interactive elements.
Content structure
Best practices
- Tagging
- Conversion
- GoLive
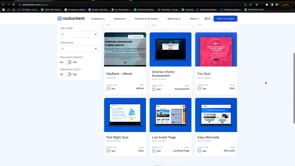
Related templates
If you like this template, you might want to check out these other similar models.
Easy Infographic
Type
Infographic

Branded Infographic
Type
Infographic
ABM Infographic
Type
Infographic
Gated Infographic
Type
Infographic